
By Hayden CG
PBM Consolidation and its Impact on Geo Prescribing Patterns
Hayden CG
Untangle Complexity
11/28/2023
Read time: 11 min
Overview
Pharmacy benefit managers (PBMs) are intermediaries in the U.S. health care system who, among other things, establish coverage and payment terms for prescription medicines. Since first emerging in the 1960s, the PBM business model has changed dramatically. Today, PBMs handle virtually every aspect of prescription drug benefit design and administration, from claims adjudication and pharmacy payment, to establishing pharmacy networks, designing formularies of covered medicines, conducting drug utilization reviews, operating various types of pharmacies (mail order, retail, and specialty), and negotiating rebates and discounts with pharmaceutical manufacturers.
As PBM services have expanded over time, competitive dynamics in the PBM industry have also changed. Following an extended period of consolidation among PBMs (i.e., “horizontal” mergers and acquisitions), today just three companies control roughly 80% of the PBM market.1 In recent years, each of these three large PBMs have affiliated with health insurers, specialty and mail order pharmacies, provider groups, and additional administrative entities such as PBM group purchasing organizations and rebate aggregators. These dramatic changes in the PBM industry (horizontal consolidation followed by a rapid spurt of “vertical” integration) have garnered the attention of policymakers and regulators alike.
This analysis seeks to answer a critical question: how does PBM concentration in local markets affect prescribing patterns and therefore patient access to medicines? We find that in markets where one of the “Big 3” PBMs is dominant, prescribers seem to demonstrate less autonomy to deviate from that PBM’s preferred list of covered drugs, even for patients not covered by the dominant PBM.
Methods
Our analysis began by selecting a measure of market concentration to describe the level of competition among PBMs in local markets (core-based statistical areas, or “CBSAs”).2 We chose the Herfindahl-Hirschman Index (HHI), which is a commonly accepted measure of market concentration used by the federal government to evaluate mergers and acquisitions.3 The HHI, which is described in greater detail in the Appendix, assigns a numerical value ranging from 1 to 10,000 to characterize market concentration. An HHI value above 2,500 indicates a highly concentrated and thus less competitive market.
Next, we assessed PBM concentration in local health care markets. Industry analysts have reported previously that at a national level, the “Big 3” PBMs (CVS Caremark, OptumRx, and Express Scripts) manage 79% of all prescription volume in the United States as of 2022.4 Using commercial market claims data from IQVIA, we calculated PBM market share for more than 900 local markets and then applied the HHI.
Finally, we sought to quantify the influence of PBM concentration on local prescribing patterns. To do this we established a new metric, “PBM Outsized Impact” (POI). For each local market, the POI indicates whether a dominant PBM’s preferred product in a therapeutic area is disproportionately prescribed to patients whose prescription benefits are managed by other payers and to what extent.
To calculate the POI, we compared the local and national market shares for products preferred by the locally dominant PBM among prescription claims not managed by the dominant PBM.5 A positive POI indicates the dominant PBM’s formulary preferences are resulting in higher-than-expected utilization, or an outsized “spillover” impact, of the PBM’s preferred product for all patients in the local market, regardless of whether those patients are covered by other payers.
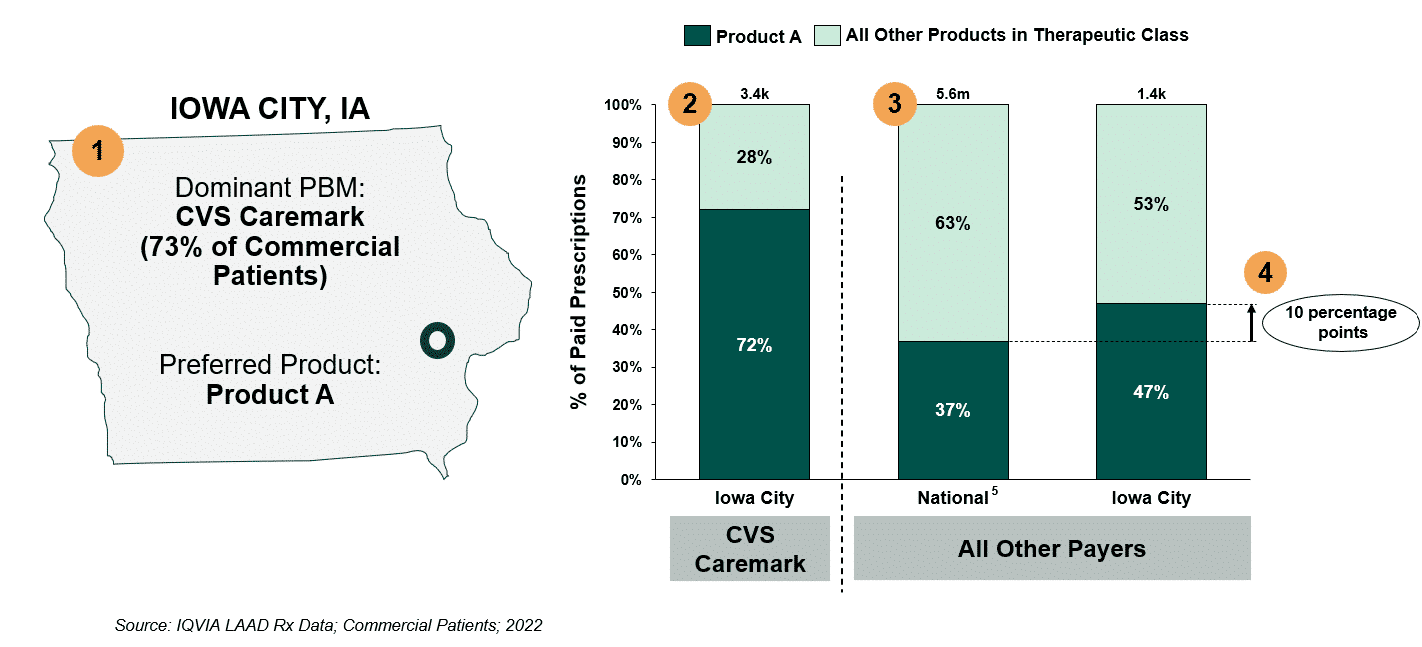
Figure 1 illustrates the POI calculation for one local market. In this example, CVS Caremark is the dominant PBM in Iowa City, Iowa, a highly concentrated market, and covers 73% of local commercial lives (#1). Its preferred respiratory product is Product A, which has a 72% market share among CVS Caremark members in Iowa City (#2). Among patients whose PBM is not CVS Caremark, Product A achieves a 47% market share in Iowa City, relative to a 37% national market share. This 10-percentage point difference in market share reflects the spillover impact of the dominant PBM, CVS Caremark, on prescribing behavior and which medicines patients in Iowa City receive (#3 and #4).
Our analysis reviewed (1) the extent to which POI exists across more than 900 local markets for eight therapeutic areas (breast cancer, non-small cell lung cancer, myeloma, immunology, diabetes, HIV, respiratory, and antipsychotics), and (2) the average magnitude of POI by therapeutic class in local markets with evidence of POI.
Figure 1: Calculation of PBM Outsized Impact (POI)
Findings
Our market concentration analysis found that nationwide, 30% of local markets show high levels of PBM concentration (low competition) and only 5% show low levels of PBM concentration (high competition).
Assessing the geographic distribution of PBM market concentration (Figure 2), we see that markets with high levels of PBM concentration (low competition) are located largely in the Northeast and Midwest. Markets with low levels of PBM concentration (high competition) are located largely in the Northwest.
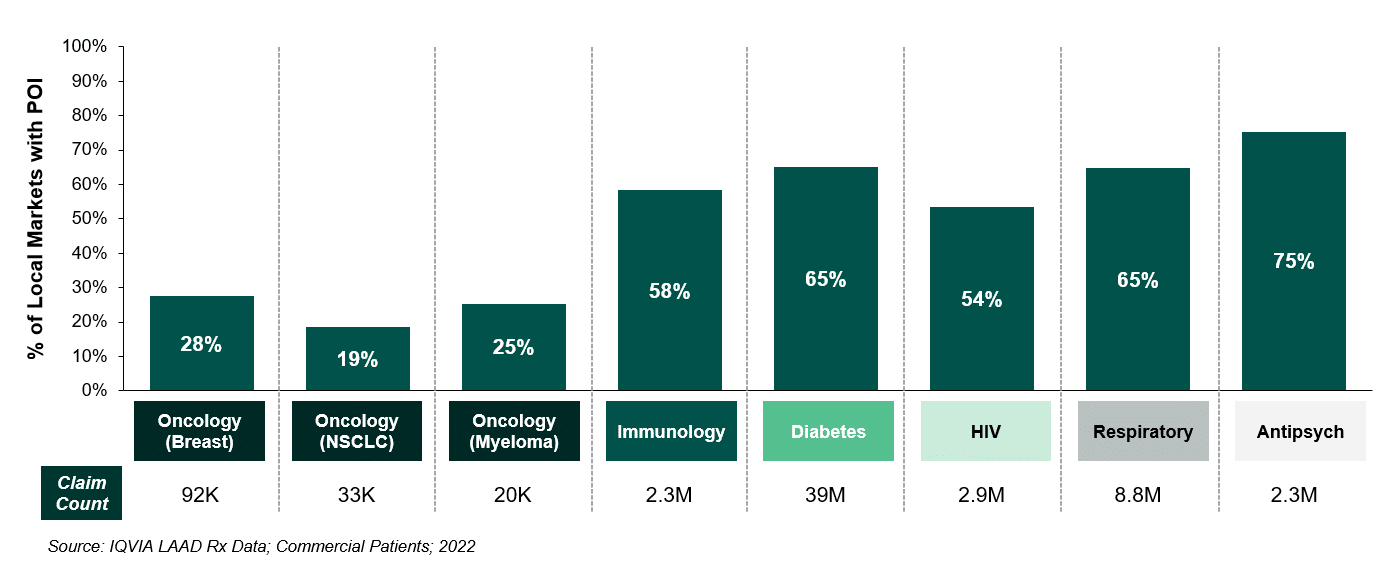
Looking at the prevalence of POI across an array of therapeutic areas including breast cancer, non-small cell lung cancer, myeloma, immunology, diabetes, HIV, respiratory, and antipsychotics, we find that POI is widespread. As shown in Figure 3, for five out of the eight therapeutic areas examined, the dominant PBM influenced prescribing patterns in more than half of local markets nationwide.
Figure 2: PBM Concentration Across Local Markets
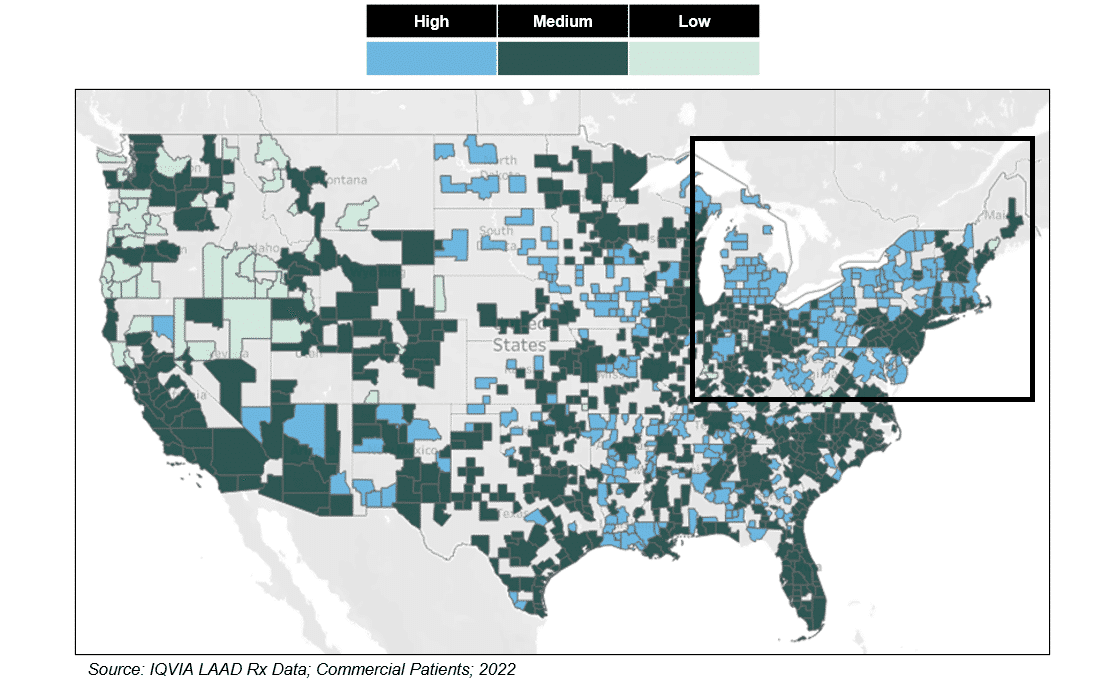
Figure 3: Prevalence of PBM Outsized Impact (POI) Across Local Markets, by TA
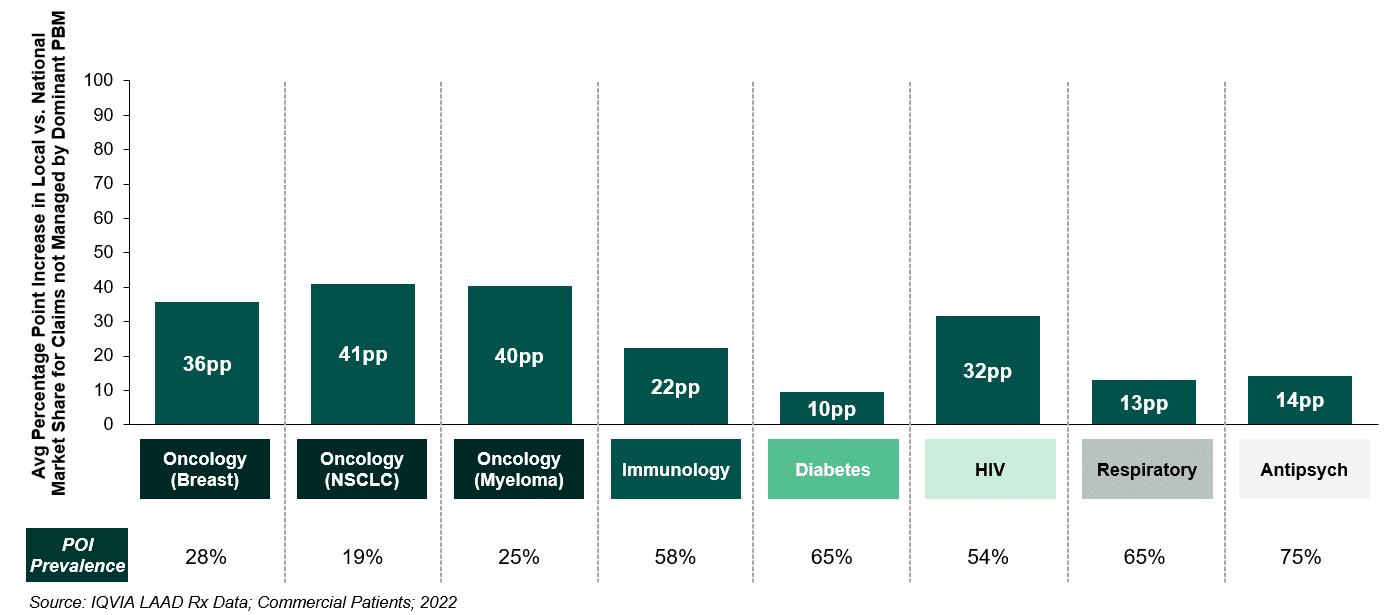
Finally, as shown in Figure 4, we found that when POI exists, the magnitude of spillover can be substantial. For example, in the 25% of local markets exhibiting POI for myeloma therapies, the product preferred by the dominant PBM achieved a disproportionately large average market share among prescription claims managed by other payers, exceeding the national market share by 40 percentage points.
Figure 4: Spillover Impact Due to PBM Market Dominance, by TA
Implications
Our findings reveal that in concentrated local markets, a dominant PBM’s choice of preferred products can influence prescribing market-wide, even for patients not covered by the dominant PBM. The magnitude of spillover varies by therapeutic area (see Figure 4), from a low of 10 percentage points for diabetes, to a high of 41 percentage points for non-small cell lung cancer. These findings have implications for patients’ access to care and underscore concerns with PBM influence expressed previously by medical professionals.6
It is important to consider why and how PBMs impact prescribing choices and thus patient access to medicines. PBMs establish formularies that govern which medicines are covered, the level of patient cost sharing, and conditions on access to certain medicines (such as prior authorization, quantity limits, or the need to first fail on another therapy). Thus, the formulary is a key tool for PBM’s to manage drug utilization and costs.
With consolidation of the PBM industry over the past 10-15 years, PBMs have gained substantial leverage in their role as an intermediary between pharmaceutical manufacturers, providers, and other stakeholders.7 In the case of brand medicines, for example, PBMs may seek price concessions from manufacturers in exchange for coverage on the formulary, lower cost sharing, or other favorable terms. This competitive process works as intended in many cases, with higher price concessions holding net spending on prescriptions in check.8 PBMs’ leverage with manufacturers (and others) is connected to their ability to deny or limit coverage of certain medicines. However, these limits can make it more difficult for patients to gain access to non-preferred drugs.
Health care providers are also impacted by PBM formulary design. For example, if a provider prescribes an excluded or non-preferred product, the patient will likely face higher out-of-pocket costs and may be less likely to fill their prescription. Non-preferred products may also carry utilization management restrictions imposed by the PBM. Prescribers may need to provide documentation and/or prescribe multiple alternative types of medicine to help a patient gain access to a non-preferred medicine.
Complying with these procedures can be time consuming and costly for patients and providers alike. It is completely foreseeable, and rational, that a provider who repeatedly encounters difficulty prescribing a certain medicine (e.g., because it is not preferred by the dominant PBM in the local market), may be less likely to prescribe that product. We believe our findings reflect this behavior change and demonstrate how the erosion of competition in PBM markets may be affecting the prescribing autonomy of health care professionals and limiting patient access to certain medicines.
With policymakers and oversight bodies like the Federal Trade Commission currently examining PBM concentration, it is important to look at local markets as well as national averages. We have observed that high levels of PBM concentration correlate with an outsized impact on prescribing in local markets. The bottom line? In some cases, patient treatment is effectively being determined by an entity with no direct stake in their health: the dominant PBM in the area.
Appendix: Utilizing the Herfindahl–Hirschman Index (HHI)
Understanding current levels of PBM concentration is a key first step in drawing conclusions about the impact such concentration may have on the market. In this analysis, the HHI was used to measure levels of PBM concentration across local markets (core-based statistical areas, or “CBSAs”). The HHI is a widely accepted measure of market concentration utilized by the Department of Justice (DOJ) and the Federal Trade Commission (FTC) as an aid when approving mergers and evaluating concerns with potential anti-competitive or monopolistic behavior. A higher HHI indicates a greater level of market concentration, and thus a lower level of competition.
The HHI is calculated by 1) assessing the market share of every competitor in the area; 2) squaring that market share figure for each competitor; and 3) summing the squares of each competitor. The most concentrated market possible would score 10,000 on the HHI index: 1 competitor with 100% market share results in an HHI index of 1002 = 10,000.
A more competitive market with 5 entities, each with a 20% market share, would result in the following HHI calculation:
Illustrative HHI Index Calculation:
In general, the DOJ & FTC consider any market in which HHI is above 2,500 to be highly concentrated and thus less competitive. A market with an HHI of 2,500 at its most evenly competitive would equate to four competitors with 25% market share, and no competitor would be able to achieve > 50% market share.
Conversely, any market in which HHI is below 1,500 is viewed to be highly competitive. At an HHI of 1,500, a market at its most evenly competitive would equate to seven competitors with 14-15% share, and no competitor would be able to achieve > 39% share.
At a national level, the “Big 3” PBMs manage 79% of all prescription volume in the U.S.9 To better understand localized PBM concentration, we analyzed IQVIA claims data, calculated relative market shares of PBMs in more than 900 local markets (Core Based Statistical Areas, or CBSAs), and then applied the HHI. Our results show that 30% of markets have low levels of competition (i.e., high PBM concentration, represented by an HHI of 2,500 or greater) and only 5% of local markets have high levels of competition (i.e., low PBM concentration, represented by an HHI of 1,500 or less).
PBM Concentration by Core-Based Statistical Area (CBSA)
Sources
[1] Fein, Adam. “Top Pharmacy Benefit Managers of 2022: Market Share and Trends for the Biggest Companies”. Drug Channels, 23 May 2023, https://www.drugchannels.net/2023/05/the-top-pharmacy-benefit-managers-of.html
[2] CBSAs consist of the county or counties (or equivalent entities) associated with at least one core (urban area) with a population of at least 10,000, plus adjacent counties having a high degree of social and economic integration with the core as measured through commuting ties. The Office of Management and Budget has established 927 CBSAs for the continental United States.
[3] See U.S. Department of Justice, Antitrust Division. https://www.justice.gov/atr/herfindahl-hirschman-index#:~:text=The%20term%20%E2%80%9CHHI%E2%80%9D%20means%20the,then%20summing%20the%20resulting%20numbers.
[4] Fein, Adam. 2023
[5] To determine a product’s expected national market share within the context of a local market, we calculated the product’s average national market share among payers other than the dominant PBM, weighted by the number of lives in the local market covered by each payer. This approach allows us to create a national market share benchmark that accounts for the payer mix unique to each local market.
[6] American Medical Association. Letter to Lena Khan, Chair of the Federal Trade Commission. April 26, 2022. https://searchlf.ama-assn.org/letter/documentDownload?uri=%2Funstructured%2Fbinary%2Fletter%2FLETTERS% 2F2022-4-26-Letter-to-Khan-re-FTC-PBM-RFI-v2.zip%2F2022-4-26-Letter-to-Khan-re-FTC-PBM-RFI-v2.pdf
[7] Herman B. “The biggest PBMs are handling more and more of the country’s drug price negotiations.” STAT+. March 22, 2022. https://www.statnews.com/2022/03/22/pharmacy‐benefit‐managers‐revenue‐contracts/; and PBM Accountability Project. “Understanding the Evolving Business Models and Revenues of Pharmacy Benefit Managers,” December 2021. https://www.pbmaccountability.org/_files/ugd/b11210_264612f6b98e47b3a8502054f66bb2a1.pdf ?index=true.
[8] IQVIA. The Use of Medicines in the U.S. 2022. April 21, 2022. https://www.iqvia.com/insights/the-iqvia-institute/reports/the-use-of-medicines-in-the-us-2022
[9] Fein, Adam. 2023